

Generating individual figure images in LaTeX
I’m excited that my paper with Isaac Gould on Japanese relative clauses will appear soon in Glossa. Isaac and I wrote this paper in Word, although I composed all the trees and some diagrams in LaTeX (about two dozen). Here’s what my file looked like, where I typeset these diagrams. I then simply copied and pasted rectangular selections of this PDF into Word.
As we prepared the manuscript for typesetting, though, I felt like I should make proper, high quality images for these trees and diagrams. Here for my own future reference is how I did this.
Setting the diagrams in Fira Sans
My diagrams for the paper were all in one LaTeX file. The Glossa style sheet asks that diagrams be set in Arial or Fira Sans, the latter being Mozilla’s FF Meta-inspired open-source font, which is the sans-serif used for abstracts and titles in Glossa papers. (By the way, Glossa sets its body text in Charis SIL.) I started by getting my diagrams set in Fira Sans, which was easy in my setup:
- Download Fira Sans and install it on my Mac. Double-clicking on the
otffiles will let you install them. - Add the following lines to the preamble. This requires that the file be compiled using XeLaTeX, the unicode-native LaTeX engine that can use system fonts. I generally always use XeLaTeX and
mathspec, so this was easy.\usepackage{mathspec} \setallmainfonts{Fira Sans}
Putting a diagram on each page with preview
Next, I wanted to get my diagrams file to output just one diagram per page. I could of course set \pagestyle{empty} and add page breaks, but I chose to use the preview LaTeX package which is designed for this purpose. First, I added the following to my preamble. The xetex option is of course because I’m compiling using XeLaTeX.
\usepackage[xetex,active,tightpage]{preview}
\PreviewBorder=40pt\relax
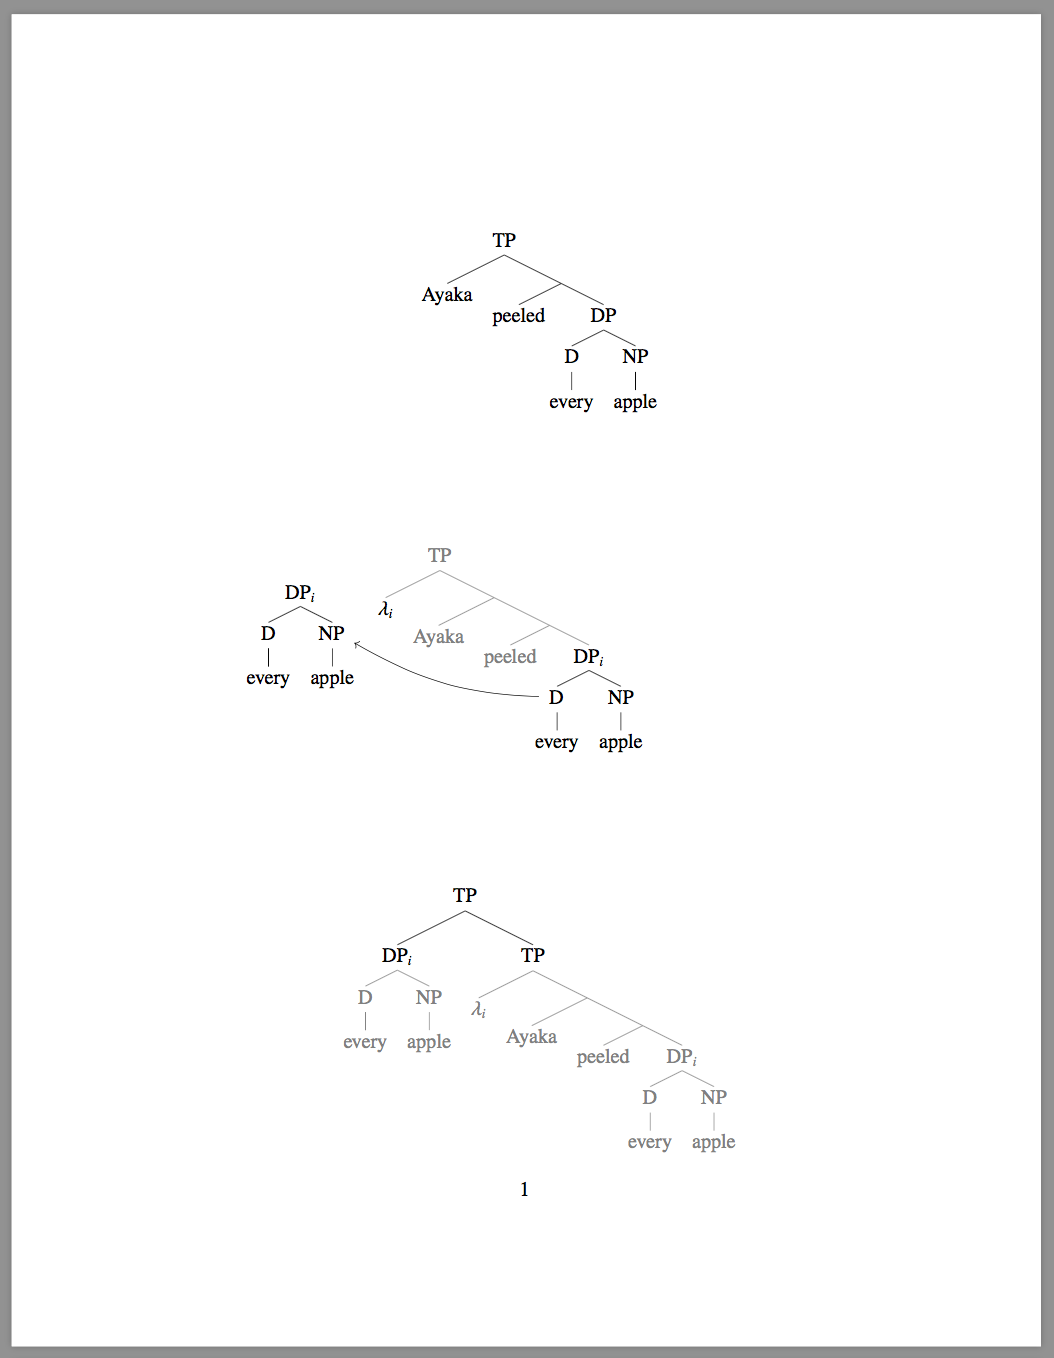
I then wrapped each logical diagram in its own preview environment. Here’s an example:
\begin{preview}
\Tree [.TP Ayaka [ peeled [.DP [.D every ] [.NP apple ] ] ] ]
\end{preview}
The advantage of using preview is that, when compiled in active mode, all other information printed outside of these preview environments are simply not printed. The result at this stage is a single PDF with one diagram on each page. Notice how each diagram has a margin; the \PreviewBorder command above requested that these margins be at least 40 points on each side. Notice also that the margins for the second diagram are confused by my use of TikZ for drawing the arrow; these individual pages will later get cropped so this isn’t a problem.
Pulling out each diagram into its own image file
Finally, I used the ImageMagick convert command to split up the PDF into individual image files. (I installed ImageMagick on my Mac using HomeBrew: brew install imagemagick .) Here’s the command I ran, in the same folder as the output file, trees.pdf:
convert -density 900 -trim -resample 300 trees.pdf figure.png
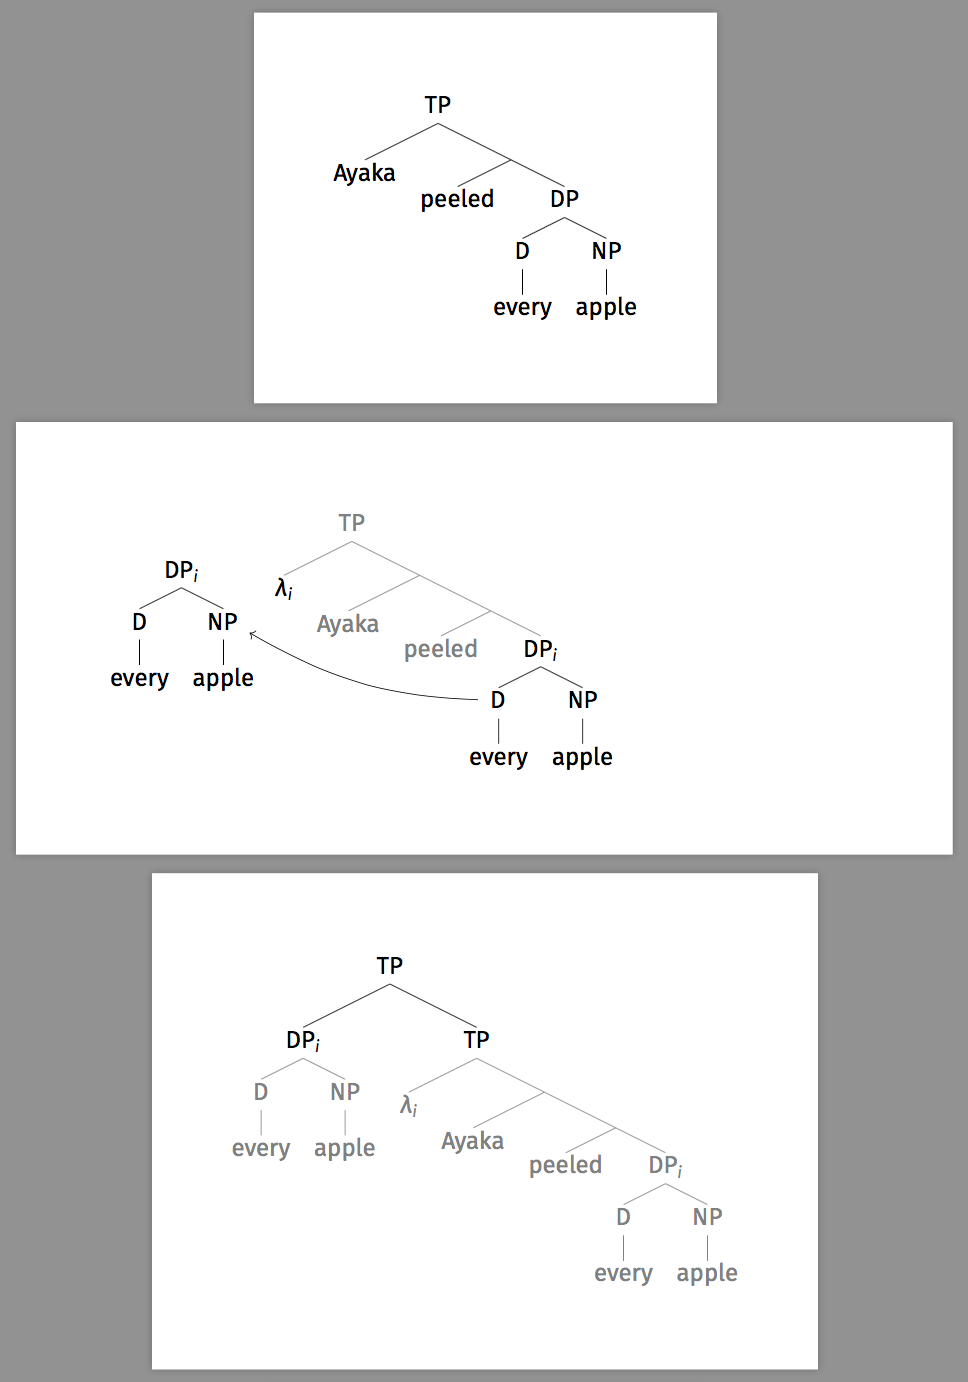
The result of this command is a sequence of figure-0.png, figure-1.png,… files being generated, one per page of the trees.pdf file. Here’s the first file:

This image might look large here because it’s rendered in 300 points per inch (ppi), which is a standard print density that Glossa requests rasterized images to be in. convert rendered this page on a transparent background and then cropped its margins (the -trim option). We then referenced each figure by name in our Word file and sent it in to Glossa.
Notice that my convert command renders each page in 900ppi and then downsamples this to 300ppi. That’s because I first tried convert -density 300 directly, and it resulted in some jagged edges. This will be even more visible if you have diagrams with finer details. Rendering at 900ppi and then downsampling to 300ppi has the effect of anti-aliasing.